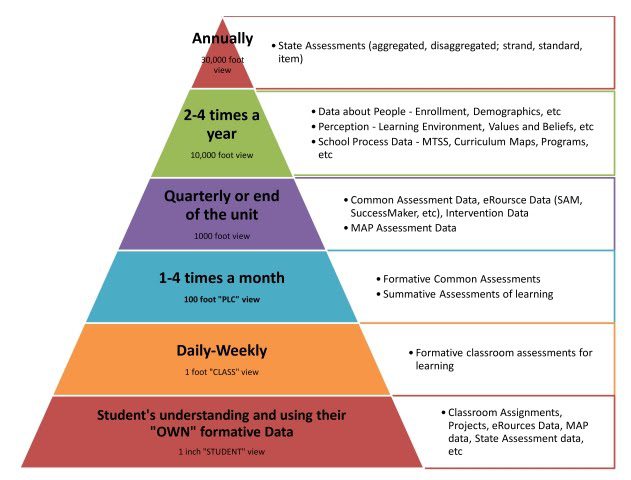
In this article, we’ll take a look at how to use pyramid charts in data analysis. Pyramid charts are used to visualize data and show relationships between data points. Pyramid charts are also helpful in making decisions about what data to focus on and identifying any patterns that may exist. Keep reading to learn more about how to use pyramid charts in data analysis.
What are pyramid charts?
Pyramid charts are a great way to display data in an easy-to-read manner. They can be used to show comparisons between different data sets, as well as changes over time. To create a pyramid chart, you first need to create a table of data. The table should have two columns: the first column should list the categories or values that will be displayed on the pyramid chart, and the second column should list the corresponding numerical values.
Once you have integrated the data into the table, you can use it to create your pyramid chart. Start by creating a bar chart with the category (or value) names on the horizontal axis and the numerical values on the vertical axis. Next, add a series of stacked bars for each category (or value), making sure that each bar starts at zero. Finally, give each bar a different color so that it is easy to distinguish them from one another.
What is data analysis?
Data analytics is the process of analyzing data to understand and improve business performance. This involves using techniques such as data mining, statistics, and machine learning to extract insights from data. Data analytics can be used to improve decision-making, optimize operations, and create new products and services. The use of data analytics has exploded in recent years, as businesses have become increasingly reliant on data to drive their decisions. The amount of data that is now available to businesses is staggering, and the ability to extract insights from this data is becoming increasingly important. The benefits of data analytics are vast. Some of the key benefits include:
- Improved decision making: Data analytics can help businesses make better decisions by providing insights into how customers behave, what products are popular, and where to allocate resources.
- Optimized operations: Data analytics can help businesses optimize their operations by identifying inefficiencies and areas where improvements can be made.
- New products and services: Data analytics can be used to create new products and services by understanding customer needs and preferences.
- Improved customer insights: Data analytics can help businesses understand their customers better and identify new opportunities.
- Reduced costs: Data analytics can help businesses identify areas where costs can be reduced.
How can pyramid charts be used in data analysis?
Pyramid charts are a great way to visualize hierarchical data. Hierarchical data is data that is organized in a hierarchy, with each level of the hierarchy corresponding to a different type of data. In a pyramid chart, the first level of the hierarchy is displayed as a series of circles, and the circles get smaller as you go down the hierarchy. You can use pyramid charts to compare different levels of the hierarchy or to compare different data sets. There are many different data sets that a business will analyze by using a pyramid chart. Some of these different data sets include financial data, sales data, customer data, and social media data.
Financial data includes information about a company’s income, expenses, assets, and liabilities. This data can be used to assess a company’s financial health. Sales data includes information about a company’s sales volume, product mix, and sales channels. This data can be used to assess a company’s market position. Customer data includes information about a company’s customers, including their demographics and purchase behavior. This data can be used to assess a company’s target market and marketing effectiveness. Social media data includes information about a company’s social media presence and engagement. This data can be used to assess a company’s brand awareness and social media effectiveness.

